Brokers have the opportunity to run some predesigned reports in Cloudmore providing useful data in both tabular and graphical formats
From the Broker menu go to Reports > Reports
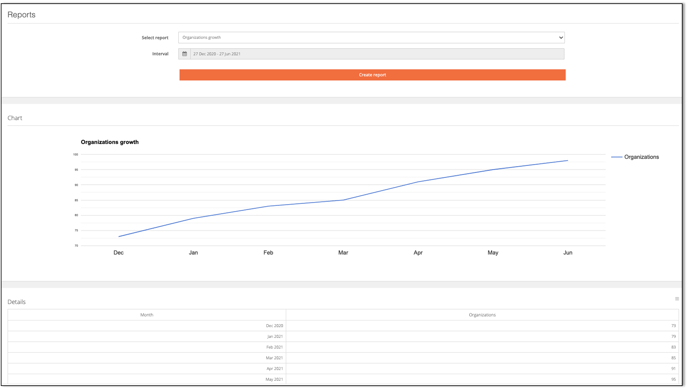
Organizations growth
View the changes in the number of organizations in both tabular and graph form for a default 6 month retrospective time span or custom range
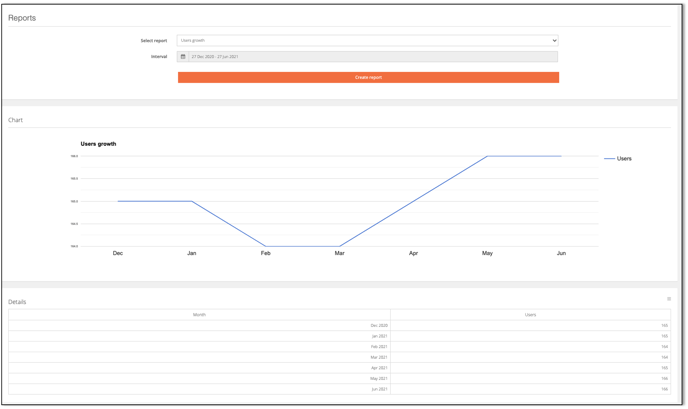
Users growth
View the changes in the number of organization users in both tabular and graph form for a default 6 month retrospective time span or custom range
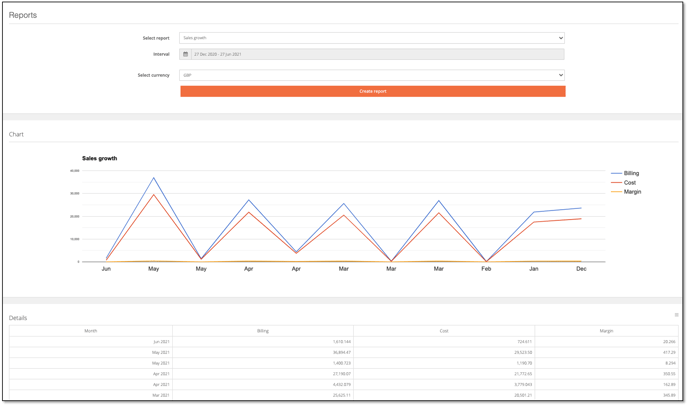
Sales growth
View the changes in the total costs, billing, and margin in both tabular and graph form for a default 6 month retrospective time span or custom range, expressed in the currency default
Sales per service over time
View the changes in the total costs, billing, and margin in both tabular and graph form for a default 6 month retrospective time span or custom range, expressed in the currency default
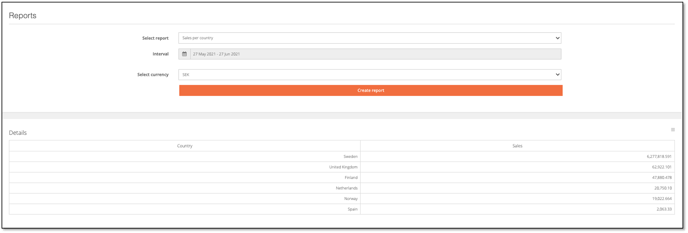
Sales per country
View the changes in the total sales in a tabular form for a default 1 month retrospective time span or custom range for each supplied organization country , expressed in the currency default
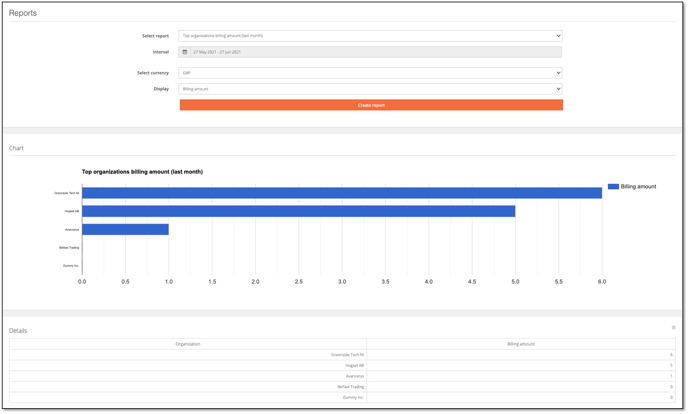
Top organizations billing amount last month
View the top 10 organizations in tabular and graphical form from one of a choice of Billing amount, cost amount, or margin for the previous financial period
 Billing Changes
View the changes in the total sales in a tabular form for a default 1 month retrospective time span or custom range, expressed in the currency default
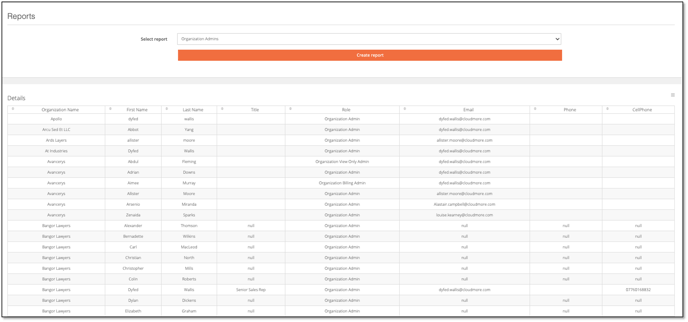
Organization Admins
View a list of organizations and those users listed with the role of Organization Admin, the list will contain contact email and telephone details